Appearance
Reading & visualising results
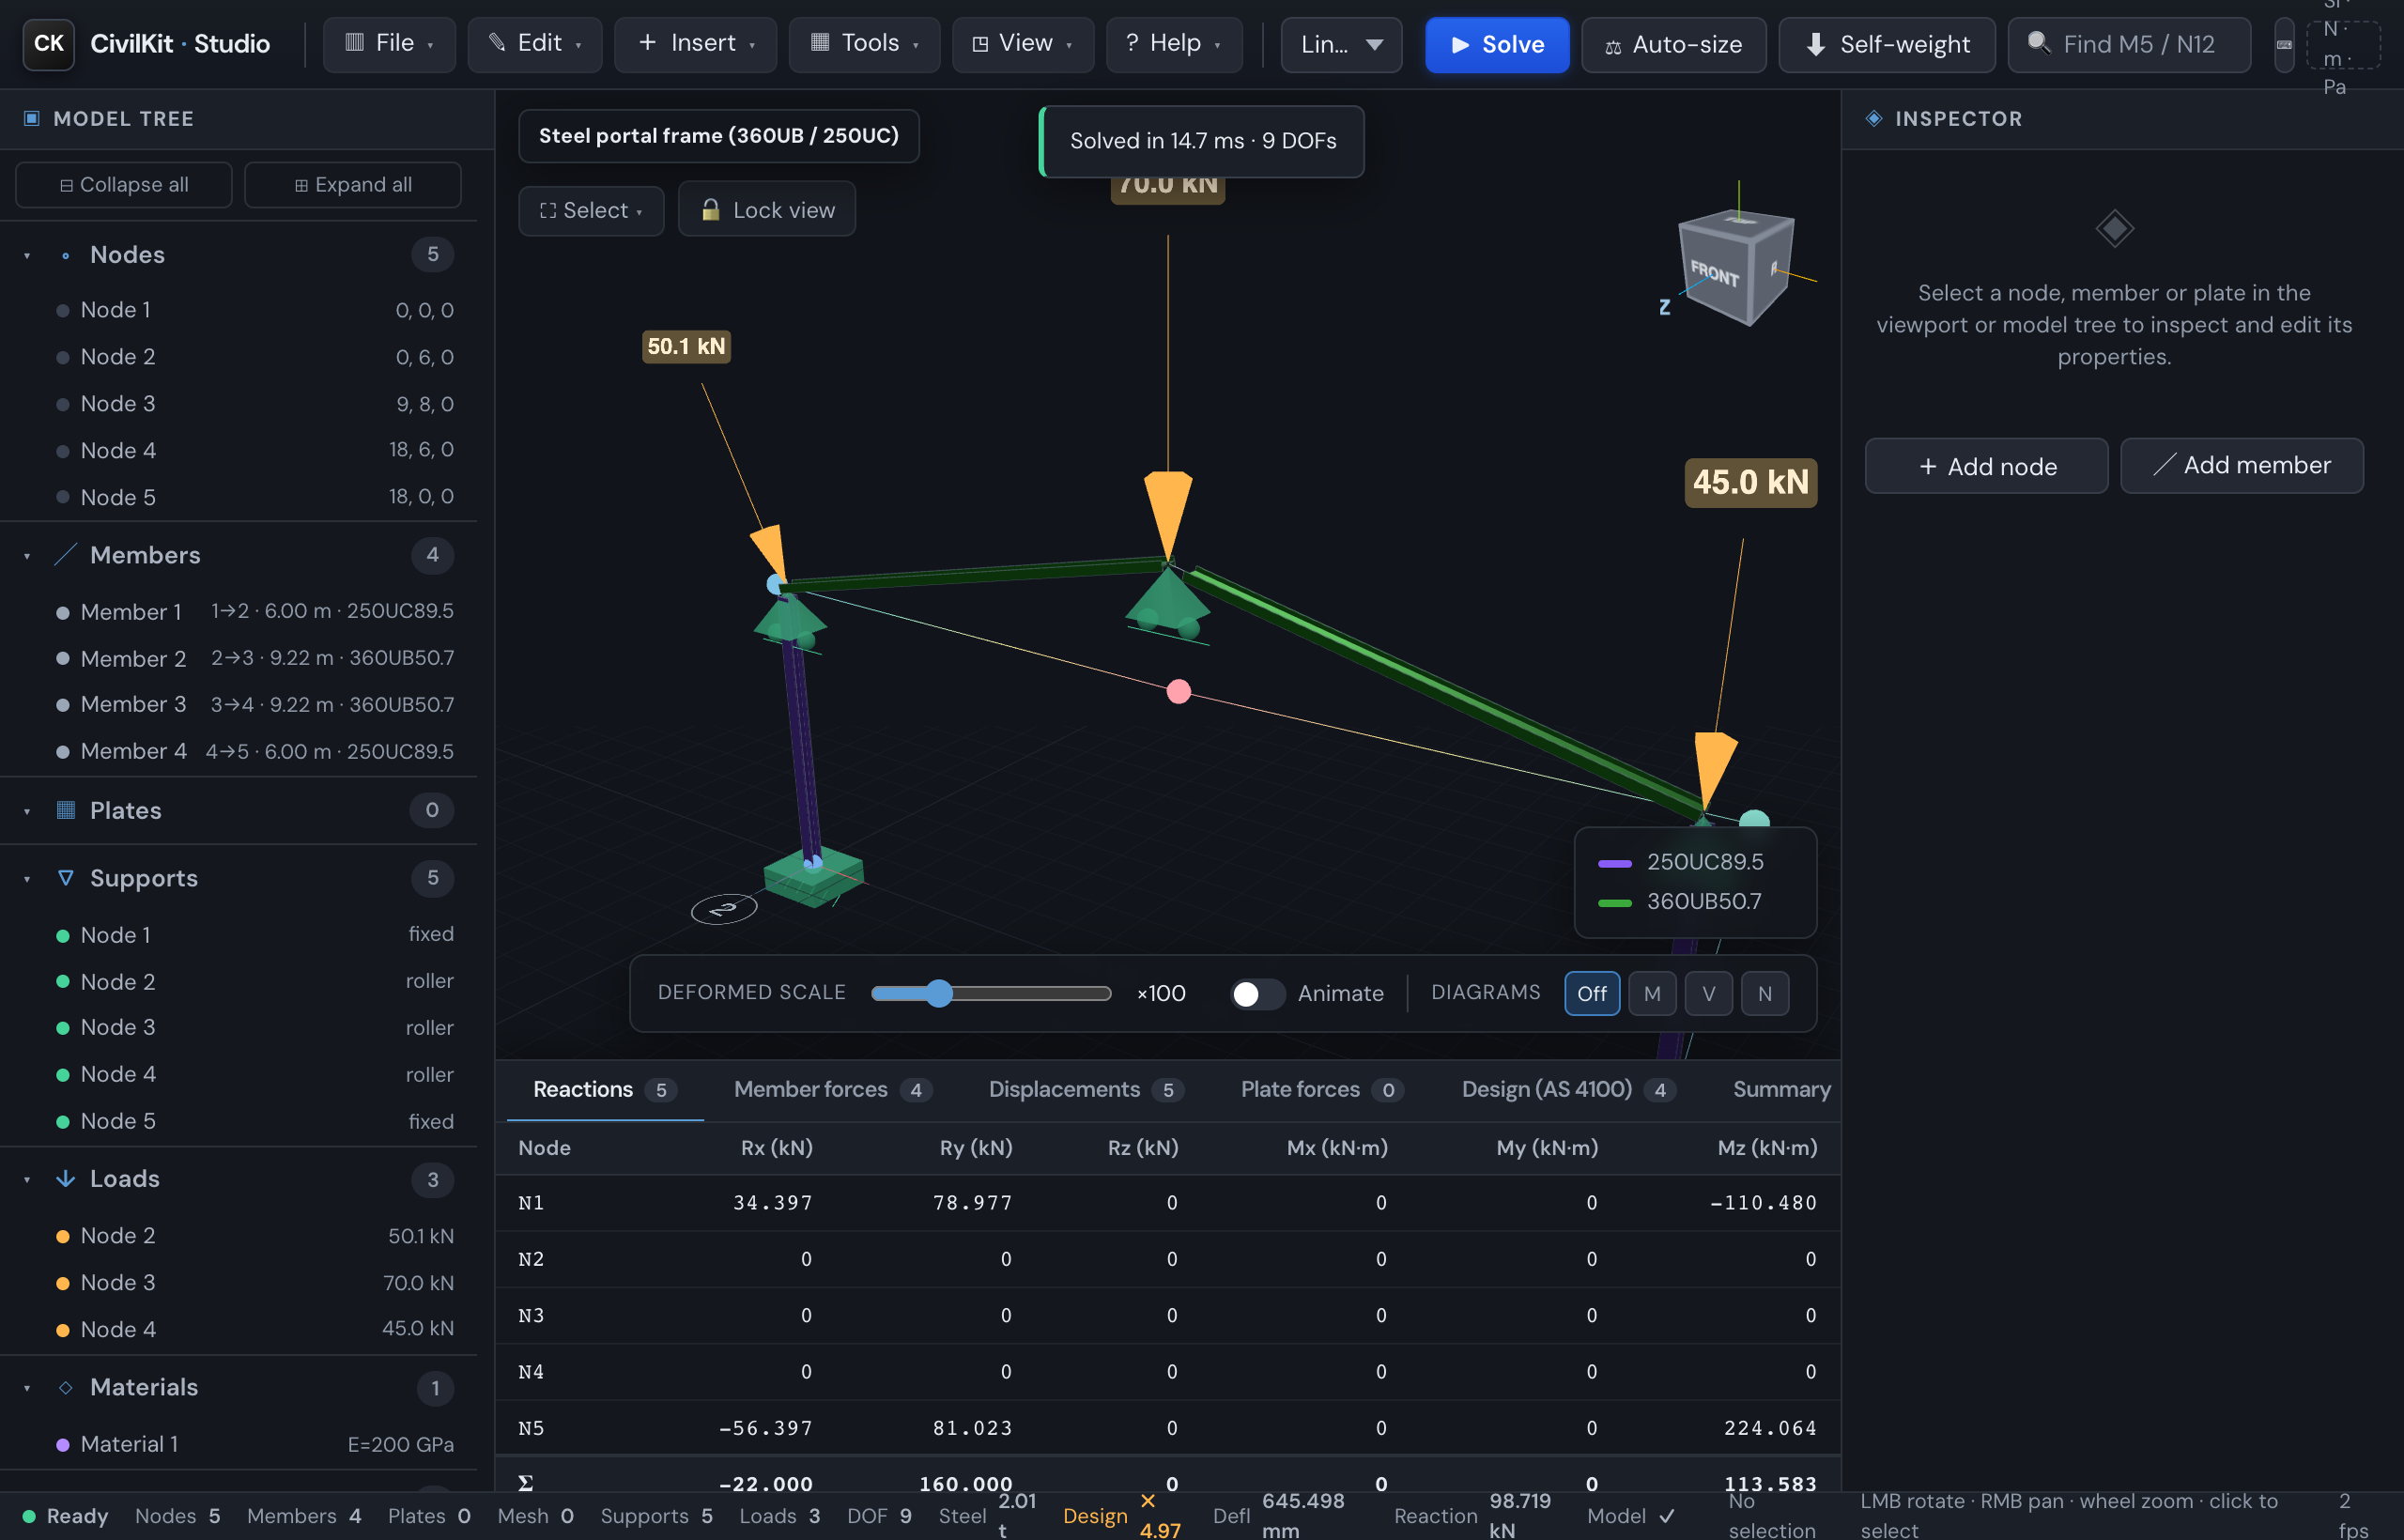
Once a model is solved, the results panel at the bottom and the 3D view fill with numbers and colour. This page explains how to read each tab and what every picture is telling you. For running the solve itself, see Analysis & results.
The results panel has eight tabs across the top, each with a count badge so you can see at a glance how much it found. Click any row in a table to select that node, member or plate in the 3D view. Click a column heading to sort by it (largest first, click again to flip).
Find, filter, copy
- Filter rows - type into the filter box (e.g.
N5orM12) to show only the matching rows in the active tab. Equilibrium total rows stay visible. - Copy - copies the visible table to the clipboard as tab-separated text; paste straight into Excel.
- CSV - downloads the visible table as a
.csvfile.
Copy and CSV respect whatever filter (and, on the Design tab, the grouping) is active, so you export exactly what you see.
Reactions
Reactions are the push-back forces at the supports - the loads the structure hands down to its footings or columns below. The largest of them is the number you carry into footing and connection design.
| Column | Meaning |
|---|---|
| Node | The supported node the reaction acts at |
| Rx, Ry, Rz | Reaction force along each axis (kN). Ry is usually the vertical (up) one |
| Mx, My, Mz | Reaction moment about each axis (kN·m), for fixed/moment supports |
The bottom Σ row totals every reaction. Below the table, an equilibrium check confirms the solve balanced: for each loaded direction it shows the sum of the reactions plus the applied load, which should cancel to (near) zero.
The equilibrium check is your first sanity test
A line like "Vertical (Y) equilibrium: ΣR ... + applied ΣF ... = 0.0 kN ✓" means the support forces exactly balance the load you applied. A ✗ (a residual that does not cancel) is a red flag that something is wrong with the model or loads. Horizontal lines (X and Z) appear only when there is sideways load, such as wind or sway, so a simple gravity frame shows just the vertical line.
The largest support reaction also appears as a chip in the status bar at all times; click it to jump to that support and open this tab.
Member forces
Member forces are the internal actions the analysis worked out for each member - how hard it is being pushed, sheared, twisted and bent. The values are reported at each end of the member (end 1 and end 2).
| Column | Meaning |
|---|---|
| N1 / N2 | Force along the member (kN). Negative is compression, positive is tension |
| Vy1 / Vy2 | Shear across the member in its local y direction (kN) |
| Vz1 / Vz2 | Shear across the member in its local z direction (kN) |
| T1 / T2 | Torsion - twist about the member's own axis (kN·m) |
| My1 / My2 | Bending about the local y axis (kN·m) |
| Mz1 / Mz2 | Bending about the local z axis (kN·m). Mz is about the strong axis |
All six actions are reported at both ends. The member carrying the largest bending moment - the critical member - is highlighted so it stands out without hunting.
Stations
Member forces gives you the two ends. A rafter's worst sagging moment is at neither of them, so the Stations tab gives all six actions at every point along every member - the same numbers the force diagrams are drawn from.
| Column | Meaning |
|---|---|
| Member | Which member the row belongs to |
| x (m) | Distance along the member from its first end |
| N, Vy, Vz, T, My, Mz | The six actions at that point |
The station carrying each member's largest bending magnitude is highlighted. On a 633-member frame this is a long table - use Copy or Download CSV in the results toolbar to take it into a spreadsheet, which is what those buttons do to whichever table is showing.
Displacements
Displacements are how far each node actually moved under load - the "how much does it sag or sway?" answer.
| Column | Meaning |
|---|---|
| ux, uy, uz | Movement of the node along each axis (mm) |
| rx, ry, rz | Rotation of the node about each axis (milliradians) |
| |u| | The total movement (all three directions combined), mm |
The node that moved the most is highlighted, and the peak deflection also shows as a status-bar chip you can click to jump to it. Whether that movement is acceptable is a serviceability question, checked on the Design tab against a span / deflection limit.
Plate forces
For models with plate (shell) elements - walls, slabs, tanks - this tab reports the stresses and bending in each plate.
| Column | Meaning |
|---|---|
| σx, σy | Direct (membrane) stress in each direction (MPa) |
| τxy | In-plane shear stress (MPa) |
| σvm | von Mises stress - a single combined "how stressed is it" number (MPa) |
| λcr | Local buckling factor, when computed |
| mx, my, mxy | Bending and twisting moments per metre width (kN·m/m) |
Select a plate to see its centroid values and the Wood-Armer design moments (the moments to size top and bottom reinforcement) in the inspector - see Concrete design.
Design (AS 4100)
This tab turns the analysis into a pass/fail steel design check - per-member capacity, utilisation and a worst-member verdict, with controls for working through a real model. It has its own page: Design checks.
Connections
When a model has connections scheduled, this tab lists them with their check status, so you can see which joints have been designed and which still need attention. Click a row to open that connection in the inspector and highlight it in 3D.
Summary
The Summary tab is the at-a-glance overview - a grid of headline cards plus a steel take-off table:
- Steel design - the governing AS 4100 utilisation and whether the structure passes (the headline result).
- Steel mass - total tonnage of the model (the figure that drops after Auto-size).
- Max displacement, Max axial force, Max bending moment - the worst values across the whole model, with where they occur.
- Σ Vertical reaction and Applied vertical load - these should match.
- Equilibrium check - OK when the reactions balance the load, with the residual shown.
- Extents - the overall length, width and height of the model.
The steel take-off table below lists each section with its count, total length and mass - a quick bill of materials.
Buckling and modal results
For a buckling analysis the Summary shows each mode's load factor (how many times the applied load causes buckling). For a modal analysis it shows each mode's natural frequency in Hz. These analyses have no member design forces, so the Design tab does not report a utilisation for them.
Console
The Console tab (the Log) is the running message log from the solver - what it did, any warnings it raised, and notes such as a building-sway check. If a solve behaves oddly, look here first. A Clear button empties it.
Visualising results
Beyond the tables, Studio paints the results onto the 3D model so you can read the whole structure at once.
- Deformed shape - the model is redrawn in its bent/sagged position. The Deformed scale slider (default ×100) exaggerates the movement so you can actually see it; real deflections are tiny. The Animate toggle makes it flex in and out. For buckling and modal analyses, this animates the mode shapes.
- Deflection contour - members and plates are coloured by how much they moved (legend bottom-left), from cool colours where nothing moves to warm where it moves most. Plate-only models are coloured by bending stress instead.
- Utilisation contour - switch the legend from Deflection to Utilisation to colour members by their AS 4100 design ratio - blue/green for spare capacity, red for overstressed. Full guide: Colour by utilisation.
- Force diagrams - the Diagrams control overlays the classic engineering diagrams on the structure, one button per action: N (axial), My and Mz (bending about each local axis), Vy and Vz (the shear that goes with each), and T (torsion). Each names its own axis, so the diagram plots the same component on every member.
- Shown as: Diagram or Colour map - the same action, two presentations. A diagram reads one member at a time; a colour map paints the whole frame by each member's peak, which answers "where is this largest" at a glance. Switching keeps the action you chose.
- Stress - a seventh button, colour map only, with a measure picker: utilisation σ/fy, von Mises, normal, shear and torsion shear. See the caution below.
- Show at or above - the slider under the legend. On a large frame everything is painted, so nothing stands out; raise the threshold and only members at or above that fraction of the scale keep their colour. The rest ghost rather than disappear, so you can still see the structure they sit in.
- Reaction arrows - green arrows at each support show the direction and relative size of the reaction, labelled in kN.
- Colour by section - colours members by which section they use, with a legend you can click to show or hide each section type. This works even before solving.
Stress is elastic, and is not a code check
The Stress measures are the elastic stress at the extreme fibre: σ/fy of 1.0 means the outermost fibre has just reached yield, not that the member has failed - a compact section carries substantially more before it forms a hinge.
They take no account of slenderness, lateral-torsional buckling, section compactness or effective length. Design utilisation in the legend is the AS 4100 check and does account for all of those. The two are deliberately named apart; do not read one as the other.
A measure the section cannot support is refused rather than approximated - a hollow section's torsion needs Bredt's formula and the enclosed area, which the catalogue does not carry, so those members are drawn grey. Grey means "not computed", never "zero", and the legend says how many and why.
What a colour map sets aside
Choosing a colour map moves the load arrows, node markers and the exaggerated deflection out of the way, and draws the members as thickened lines - a solid extrusion at building zoom is a few pixels of steel with the colour lost inside it. The legend lists whatever it set aside, and everything comes back when you leave the map. A Deflection contour keeps its deformed shape, because that shape is what it is a contour of.
The ramp is scaled to the 95th percentile so a handful of hot members cannot compress everything else into one colour. When that happens the legend says so and gives the true peak, and the scale reads with a +.
Bending diagrams are drawn on the tension side
The bending moment (M) diagram is plotted on the tension face of each member, the Australian convention - so the diagram bulges towards the side that is being stretched. Select a member to label that member's peak; with nothing selected, the largest peaks across the model are labelled.
The Values toggle labels whatever is being shown: nodal displacement with no map up, and the mapped quantity in its own unit - MPa for a stress, kN or kN·m for an action - while one is.
Units
On-screen results use engineering units (kN, kN·m, mm, MPa), or imperial if you set that in Settings. To put any of these pictures into a calculation package, use File ▸ Save image (PNG), or generate a full PDF report.